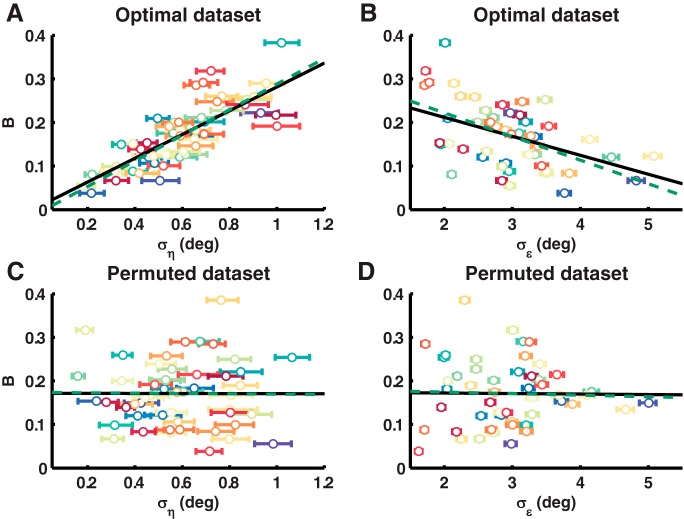
Figure 3.
Test-retest properties of the Bayesian state-space model. A, B, Regression of onto (A) and (B) for the simulated optimal dataset. C, D, Regression of onto (C) and (D) for the simulated permuted dataset. Parameter estimates with 68% HDIs are shown for every simulated learner as a dot with error bars. The black solid line shows the regression on the model parameters estimated with the Bayesian state-space model, the green dashed line the regression on the original model parameters.

