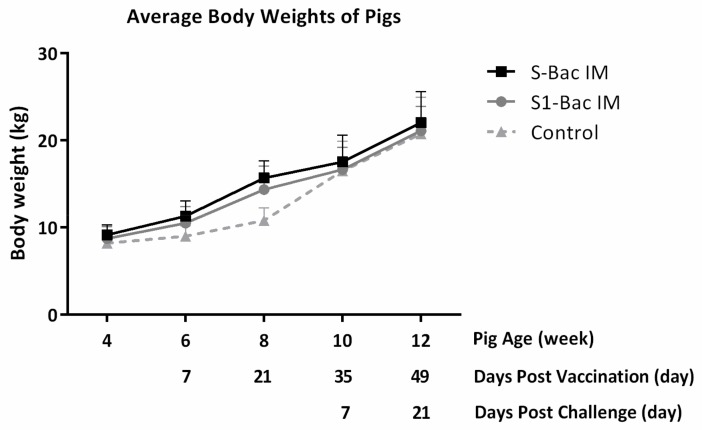
Figure 9.
The average body weight of piglets in each group. The body weight of the piglets was measured in two-week intervals since the piglets were 4 weeks old. The X axis is the time line, indicating the age of the piglets, days post vaccination, and days post challenge. The piglets were vaccinated twice at 5 weeks old and 7 weeks old (labeled with white arrows); the piglets were challenged with 5 × 10⁵ TCID50 PEDVPT-P6&7 at 9 weeks old (labeled with a black solid arrow). The Y axis is the averaged body weights of five piglets in each group. The error bars represent the SD values of each group in different time points. The solid line with square icons and the gray line with round icons represent the average body weights of pigs in the S-Bac group and S1-Bac group, respectively. The average body weight of pigs in the control group is expressed as the dotted line with triangle icon.

