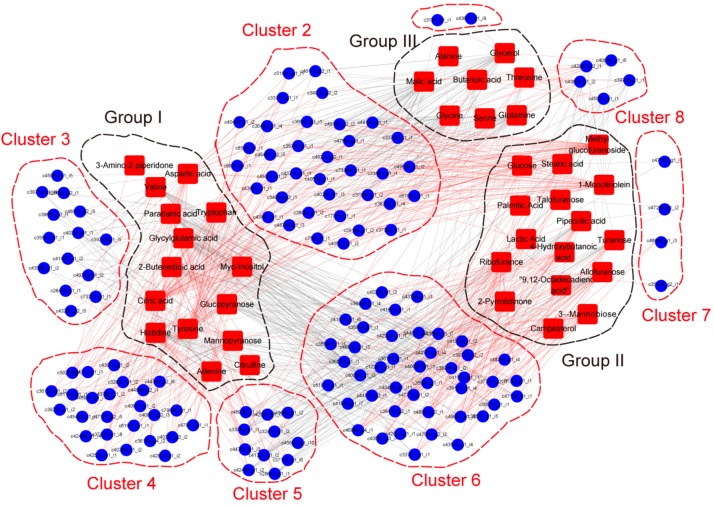
Figure 6.
Connection network between regulatory genes and metabolites. The networks between metabolome and transcriptome data were visualized by the Cytoscape software (The Cytoscape Consortium, San Diego, CA, USA, version 2.8.2). Metabolites were divided into groups and DEGs were divided into clusters. Red lines represent positive correlations and grey lines represent negative correlations.

