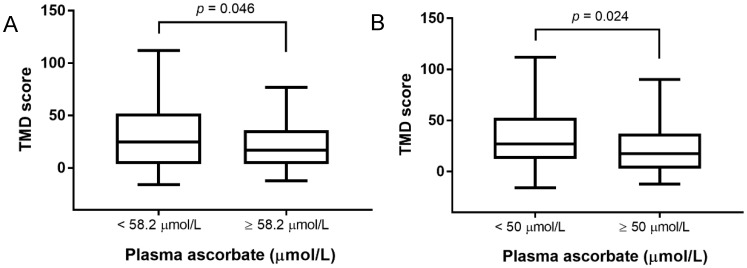
Figure 1.
Relationship between total mood disturbance (TMD) score and plasma vitamin C concentration. (A) Participants were divided around the mean plasma vitamin C concentration of 58.2 µmol/L. (B) Participants were divided around adequacy of vitamin C status (a plasma concentration of 50 µmol/L indicates adequacy). Box plots show median TMD score with the 25th and 75th percentiles as boundaries; whiskers indicate the minimum and maximum of all the data. The TMD score was significantly different between the two groups for each graph (Mann–Whitney U test on ranks).

