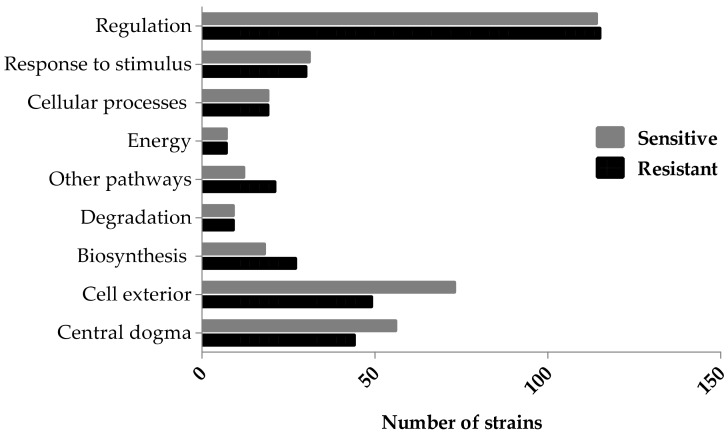
Figure 2.
Ag-resistant and -sensitive gene hits mapped to component cellular processes. The cutoff fitness score implemented was −0.15 and 0.15 (two standard deviations from the mean) and the gene hits with a score less or greater than, respectively, were chosen for further analyses. The hits were mined using the Omics Dashboard (Pathway Tools), which surveys against the EcoCyc Database. Several gene hits are mapped to more than one subsystem. The p-value was calculated as a two-tailed t-test and significance was determined using the Benjamini-Hochberg procedure; false discovery rate was selected to be 0.1. Each individual score represents the mean of 12 trials.

