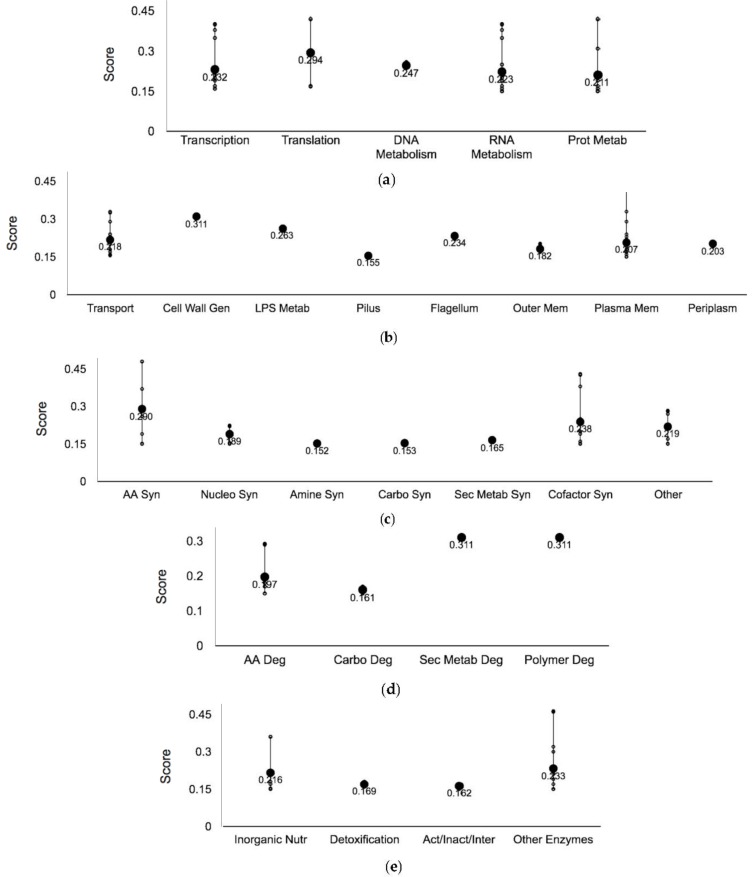
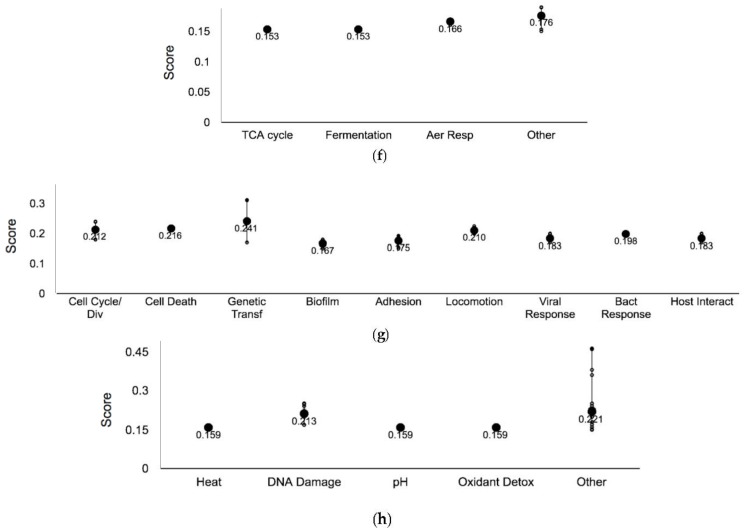
Figure 4.
Ag-resistant gene hits plotted against respective cellular processes. Y-axis representative of the normalized score, smaller circles represent the individual hits and the larger circles represent the mean of each subsystem. The p-value was calculated as a two-tailed t-test and significance was determined using the Benjamini-Hochberg procedure; false discovery rate was selected to be 0.1. Each individual score represents the mean of 12 trials. (a) Central Dogma; (b) Cell exterior; (c) Biosynthesis; (d) Degradation; (e) Other pathways; (f) Energy; (g) Cellular processes; and (h) Response to stimulus. Plots constructed using Pathway Tools, Omics Dashboard.


