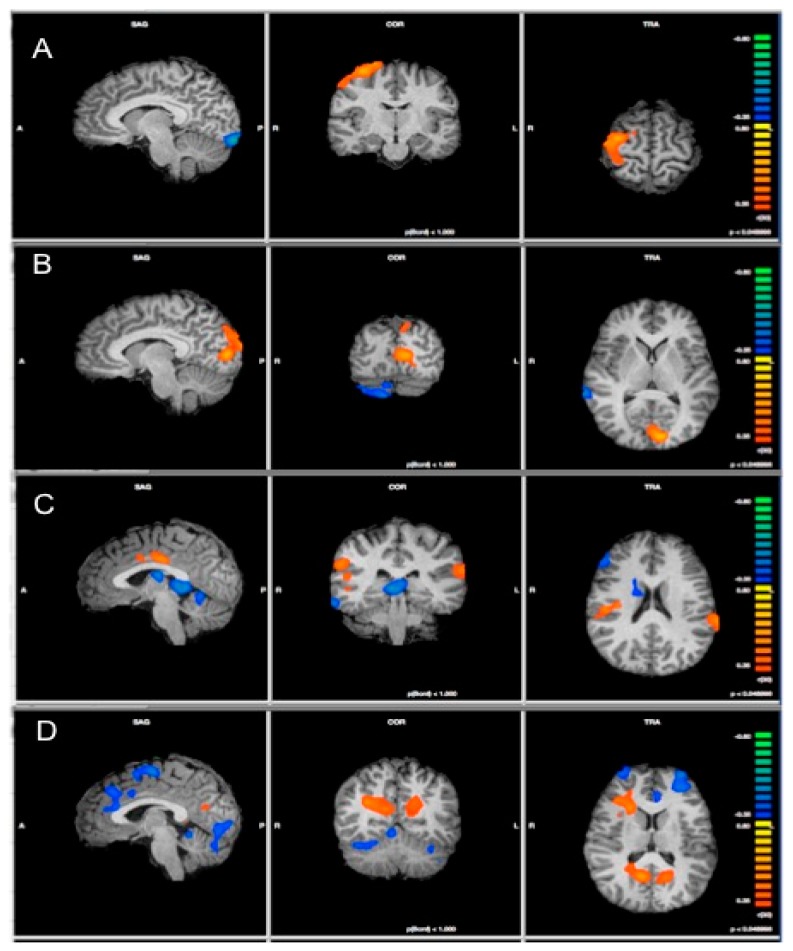
Figure 1.
Results of analysis of covariance (ANCOVA) showing regions of significant correlation between trait emotional empathy scores and the functional connectivity within each of the four components representing the networks: (A) Default Mode; (B) Salience; (C) Left Central Executive, and (D) Right Central Executive network. Positive correlations are indicated in orange while negative correlations are indicated in blue. Maps are displayed at p < 0.05 with a cluster threshold estimator applied to reduce false positives.

