Figure 2.
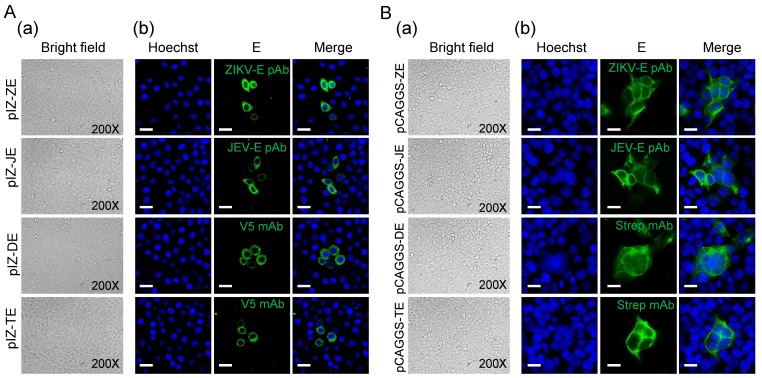
Transient expression of flavivirus E proteins. (A) Morphology of Sf9 cells transfected with pIZ-ZE, pIZ-JE, pIZ-DE, and pIZ-TE. (a) The bright field of transfected cells at 48 h p.t.; (b) E protein expression was detected by IFA at 48 h p.t. E proteins (green) were detected with indicated antibodies. Nuclei were stained with Hoechst as shown in blue. Bars, 10 μm. (B) Morphology of 293 T cells transfected with pCAGGS-ZE, pCAGGS-JE, pCAGGS-DE, and pCAGGS-TE. At 18 h p.t, cells were treated with low pH (6.0) DMEM for 30 min and then cultured using DMEM (normal pH) for 18 h. (a) The bright field of transfected cells 18 h after low pH treatment; (b) E protein expression was detected by IFA 18 h after low pH treatment. E proteins (green) were detected with indicated antibodies. Nuclei were stained with Hoechst as shown in blue. Bars, 10 μm.

