
Figure 1. Trend in BP control by race over 24 months at Richard Fine People’s Clinic (RFPC) and 15 months at the other 11 clinics in the San Francisco Health Network (SFHN).
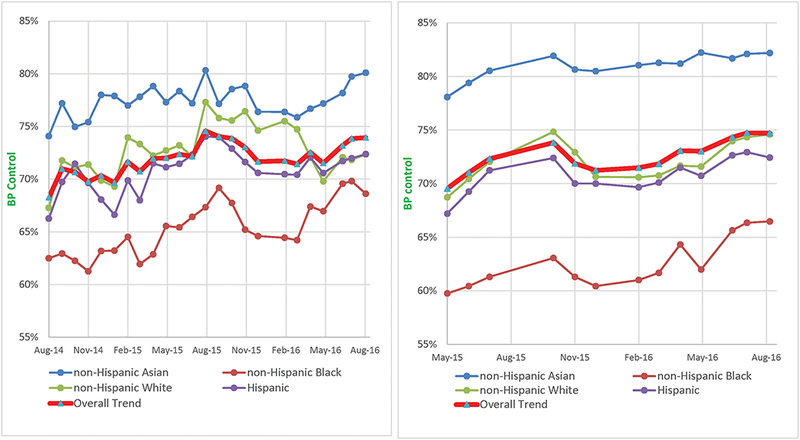
The panel on the left displays trends at RFPC and the panel on the right displays trends at the other 11 clinics.
Unadjusted trend in monthly BP control rates; BP control was defined as <150/90 mmHg for patient who are 60 years or older and do not have diabetes and <140/80mgHg for all other patients. The points on the graph represent the overall BP control monthly BP control rates calculated at the clinic level (# of patients with BP control divided by # of active patients with hypertension).