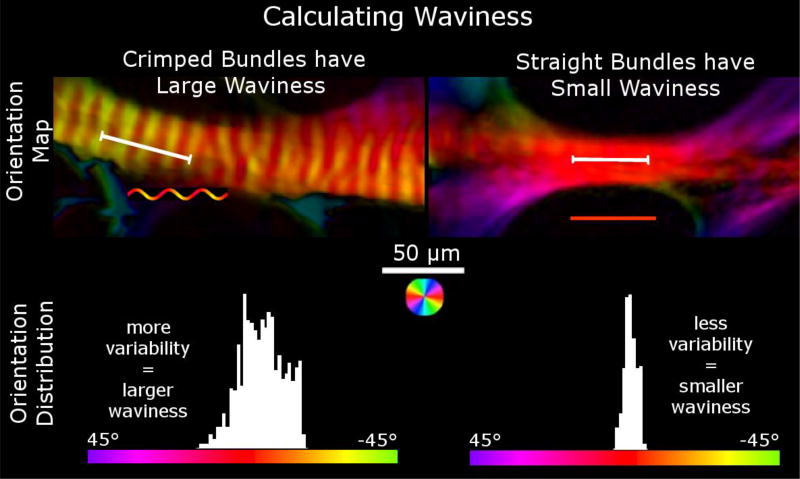
Figure 3. Orientation maps of two trabeculae beams of the LC and the orientation distributions across lines (the white line segments) drawn along each beam.
Waviness is calculated using the circular standard deviation of the collagen fiber orientations through a fiber bundle. The histograms show the distribution of orientations of the pixels under the line. In wavy crimped fiber bundles, the orientation distribution is more variable, resulting in larger waviness values (left) while in straight fibers, the distribution is less variable, resulting in smaller waviness values (right).

