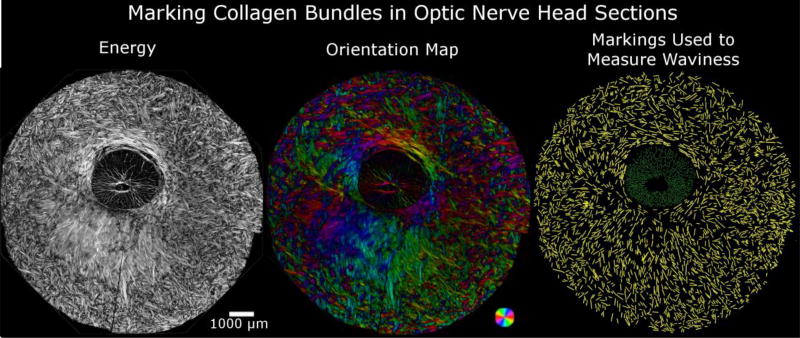
Figure 4. Manual markings of collagen bundles in images of the ONH used to measure waviness.
Example energy image of a coronal section of the posterior pole centered on the optic nerve head (left). Fiber distribution and orientation are best visualized using PLM-computed orientation with intensity scaled by energy (middle). Using manually placed lines, we measured the waviness in the PPS (yellow) and the LC (green).

