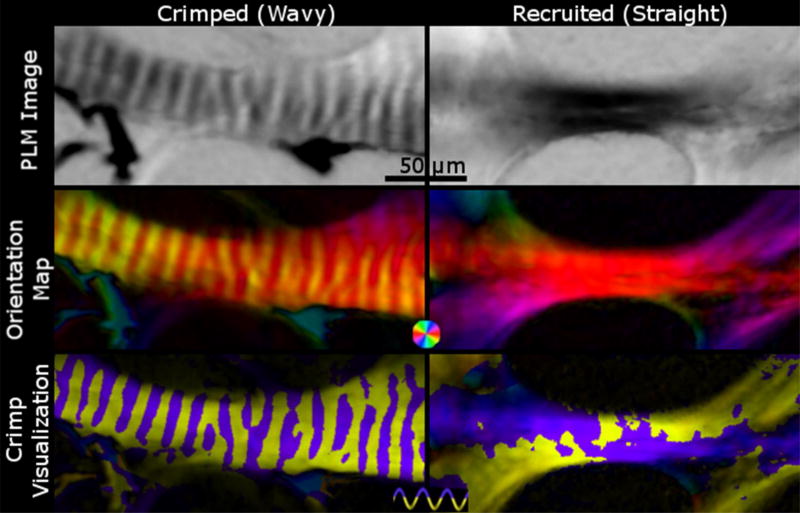
Figure 6. The crimp visualization of a crimped fiber versus a straight fiber.
Crimped, unrecruited wavy fibers (left) show changes in intensity in PLM images (top left), periodic changes in color in orientation maps (middle left), and distinct purple and yellow bands (bottom left). Recruited, straightened fibers (right), on the other hand, show a consistent intensity in PLM images (top right) and color in orientation maps (middle right), and patchy yellow and purple in the crimp visualization plot (bottom right). In addition, the crimp visualization of straight fibers fail to show clear bands of purple and yellow.

