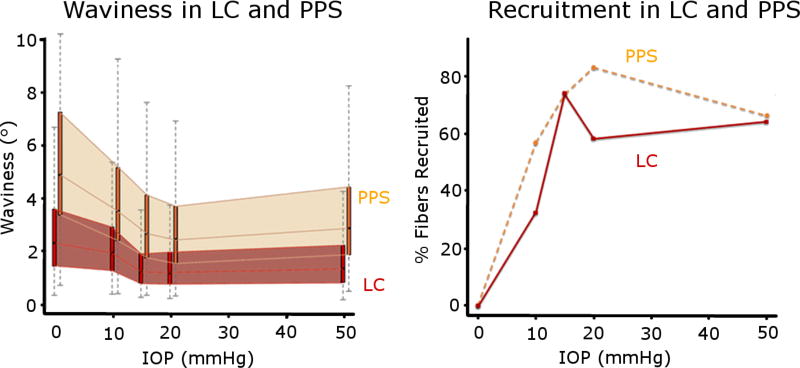
Figure 8. Waviness and recruitment in the LC and PPS.
At each IOP, we obtained the distributions of the collagen waviness in the LC (red) and PPS (orange), represented here as thin box plots.(left) The 25th to 75th percentiles of the waviness as each IOP were shaded to highlight the distinct differences between LC and PPS. The resulting recruitment curves were also significantly different between LC and PPS (right). The LC consistently had lower waviness than the PPS and also reserved the same or a larger percentage of fibers than the PPS at every IOP. At 15 mmHg both the LC and PPS had ¾ of their fibers recruited and ¼ in reserve.

