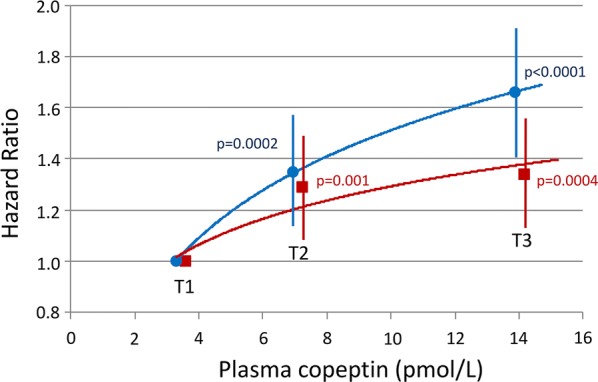
Fig. 2.

Hazard ratio (HR) with 95% confidence interval, and p-values for tertiles of baseline plasma copeptin (T3 or T2 versus T1), in Cox regression analyses of the incidence of cardiovascular events during follow-up. Pooled data from DIABHYCAR to SURGENE cohorts. Model 1 (blue circles): adjusted for cohort, sex, age, BMI, duration of diabetes, systolic blood pressure, arterial hypertension, HbA1c, total cholesterol, HDL-cholesterol, triglycerides, active tobacco smoking, and previous history of myocardial infarction at baseline. Model 2 (red squares): model 1 plus adjustments for KDIGO eGFR categories and UAC categories (normo, micro or macroalbuminuria) at baseline
