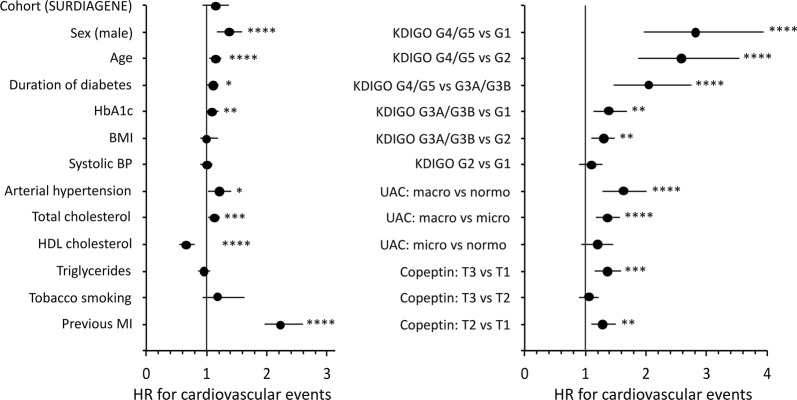
Fig. 3.
Forest plot showing Hazard Ratio (HR) and 95% confidence interval for baseline covariates included in the Cox regression analysis for the incidence of cardiovascular events during follow-up (Model 2). Pooled data from DIABHYCAR and SURGENE cohorts. Quantitative covariates are expressed as qualitative dichotomous (below or above the median) variables except for UAC (normo-, micro- or macroalbuminuria) and copeptin (expressed as increasing sex and cohort specific tertiles, T1 to T3). MI: myocardial infarction. Estimated glomerular filtration rate (eGFR) calculated with the CKD-EPI equation. KDIGO categories (G1 to G5) defined by decreasing eGFR values (see methods). UAC: urinary albumin concentration. *p < 0.05, **p < 0.01, ***p < 0.001, ****p < 0.0001

