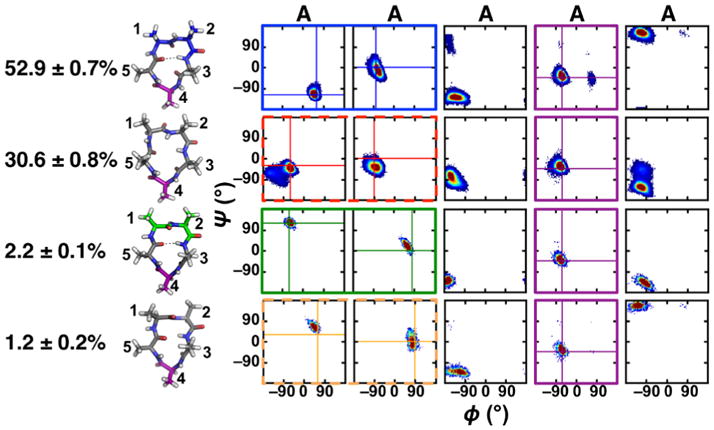
Figure 2.

Populations, representative structures and Ramachandran plots for the top four clusters of cyclo-(AAAAA). Type II β, type II′ β and αRturns are shown and boxed in the Ramachandran plots in green, blue and purple, respectively. Distorted type I and I ′ β-turns are boxed in the Ramachandran plots by red and orange dashed lines, respectively. Populations and standard deviation were calculated from the five neutral replicas of the S1 simulation.
