Figure 1.
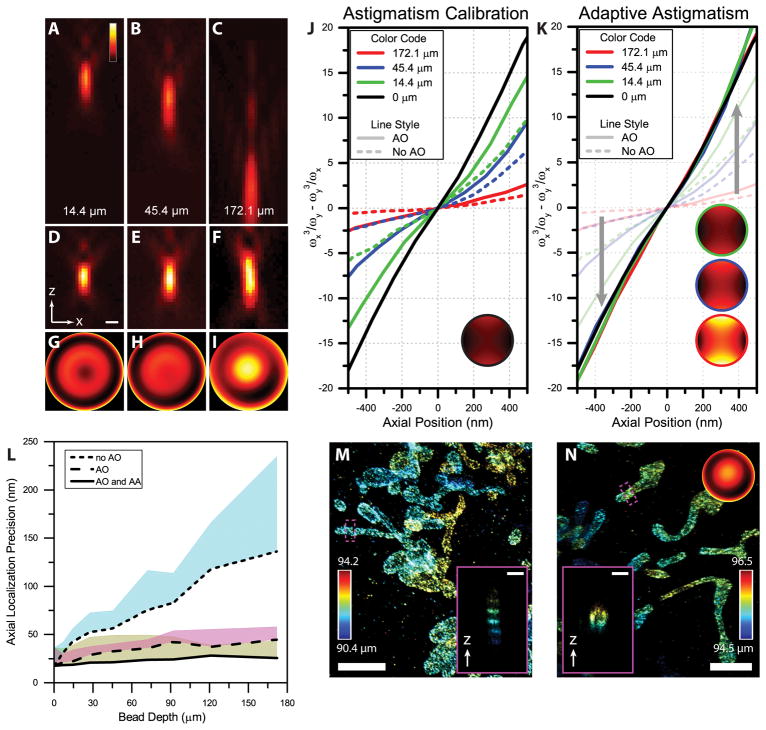
Characterization and demonstration of AO and AA in beads and cultured cells. (A–C) x-z views of PSFs (100 nm beads) at depths of 14.4 μm, 45.4 μm and 172.1 μm, respectively, without AO correction. (D–F) AO corrected PSFs at depths corresponding to the PSFs in A–C. (G–I) Magnitude of Zernike Modes used to remove depth and sample aberrations in A–C. (J) Astigmatic shape modulation around the focal plane at different depths with AO correction (solid lines) and without AO correction (dashed lines). A constant astigmatism was used at all depths (see inset). (K) Astigmatic shape modulation with AA which adaptively changes the amplitude of astigmatism at each depth (see insets, color outlines correspond to depth) to create a consistent shape modulation through a large axial range. A total of nine beads at different depths were recorded (Supplementary Figure 2, 4) (L) Theoretical axial precision limit calculated using the Cramér-Rao Lower Bound for the beads in A–K. The line represents the optimal precision achievable within ±500 nm from the original focal spot. The shaded regions are an average of the axial localization precisions from ±500 nm from the optimal axial localization precision calculated for each depth. (M) Super resolution image of mitochondria in a COS-7 cell labeled with TOM20-Alexa647 without AO correction, imaged through a depth of ~90 μm. The inset shows the cross-section of the mitochondria. (N) Super resolution image of mitochondria in a COS-7 cell and imaged through a depth of ~95 um with AO correction and AA (Supplemental Note 1). The inset shows the axial profile of the region in the magenta box. M, N serve as demonstration of large aberrations and are representative images from three data sets. Scale bars for A–F and the insets in M and N are 500 nm. Scale bars in the main part of M and N are 2.5 μm.

