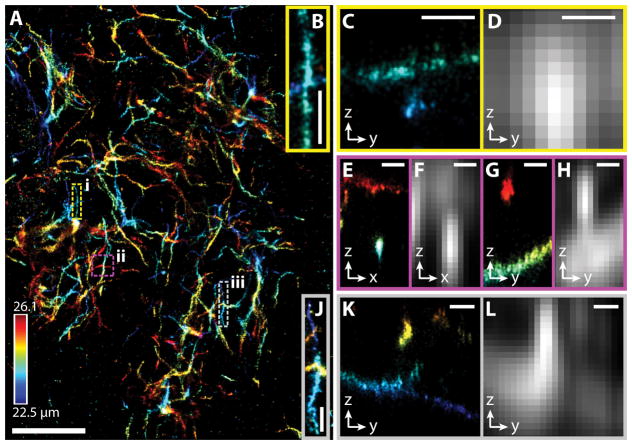
Figure 2.
3D-SMSN image of an amyloid plaque in a 30 μm mouse cortex section. (A) 3D-SMSN image of Aβ plaque located at a depth ~24 μm with a thickness of ~3.6 μm. (B) Zoom-in sub-region from A enclosed in the dashed yellow box (i). (C) y-z cross section from panel B. The two crossing filaments are ~650 nm apart. (D) Equivalent confocal images (Online Methods) created by convolving the localized molecules in (C) with the expected PSF from a confocal microscope imaging at a depth of ~24 μm. (E, G) x-z and y-z cross sections, respectively, from the magenta box (ii) in A. The two filaments are separated by ~1.7 μm. (F, H) Equivalent confocal microscope images from the regions E and G. (J) Region enclosed in the gray box (iii) in A. (K) y-z cross section from J. The filaments are separated by ~1.1 μm. (L) Equivalent confocal microscope image from K. Scale bars: 5 μm in A and 500 nm in B–L. Color bar in A corresponds to the depth from the coverslip surface. The presented image is representative of 37 different imaged plaques.

