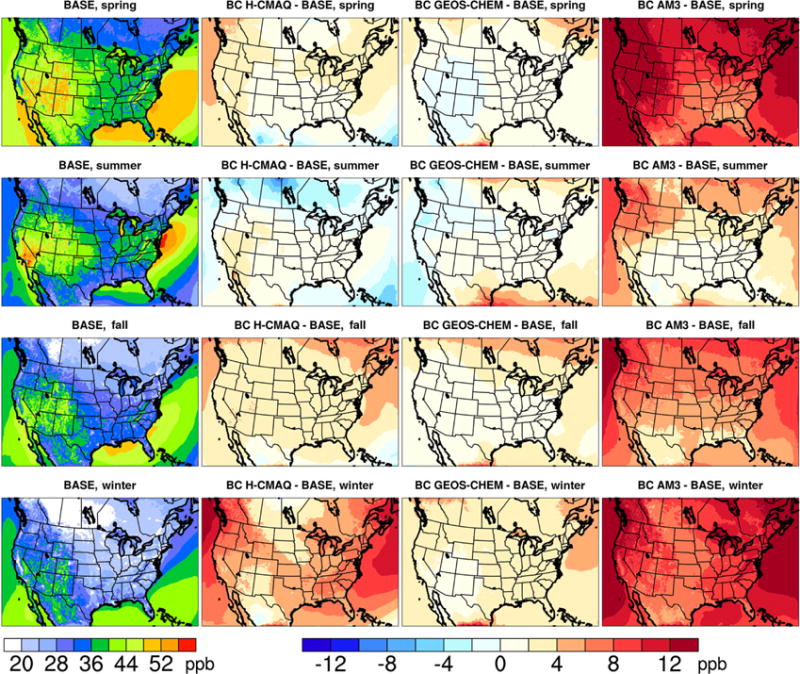
Figure 10.

Maps of seasonal mean ozone mixing ratios at the surface for the BASE, BC H-CMAQ, BC GEOS-Chem, and BC-AM3 simulations. The left column shows the mixing ratios for the BASE simulation while the second, third, and fourth columns show the differences between BC H-CMAQ and BASE, BC GEOS-Chem and BASE, and BC AM3 and BASE, respectively.
