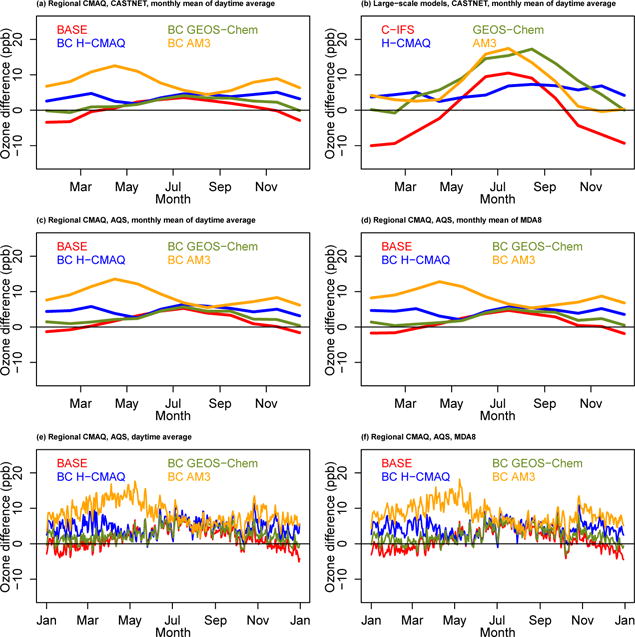
Figure 11.

Time series of differences between modeled and observed ozone mixing ratios. (a) Monthly means of daytime average mixing ratios at CASTNET monitors for regional model simulations, panel (b) is the same as (a) but for large-scale models, panel (c) is the same as (a) but for AQS monitors, panel (d) is the same as (c) but for monthly means of MDA8 instead of monthly means of daytime average mixing ratios, panel (e) is the same as (c) but for daily daytime average mixing ratios, and panel (f) is the same as (d) but for daily MDA8.
