Figure 2.

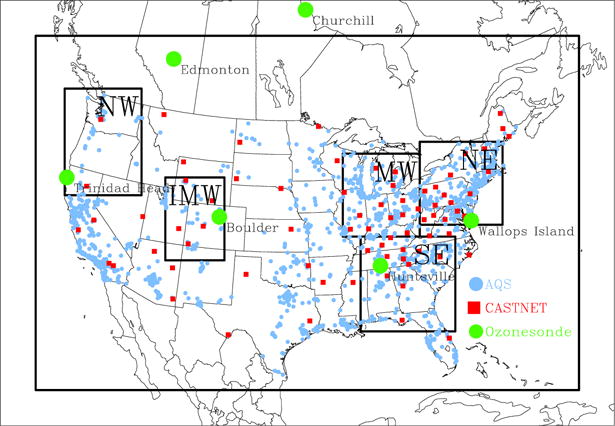
Map of the 12 km CMAQ modeling domain, the five analysis domains, and the location of the AQS and CASTNET surface O3 monitoring stations and ozonesonde launch sites.

Map of the 12 km CMAQ modeling domain, the five analysis domains, and the location of the AQS and CASTNET surface O3 monitoring stations and ozonesonde launch sites.