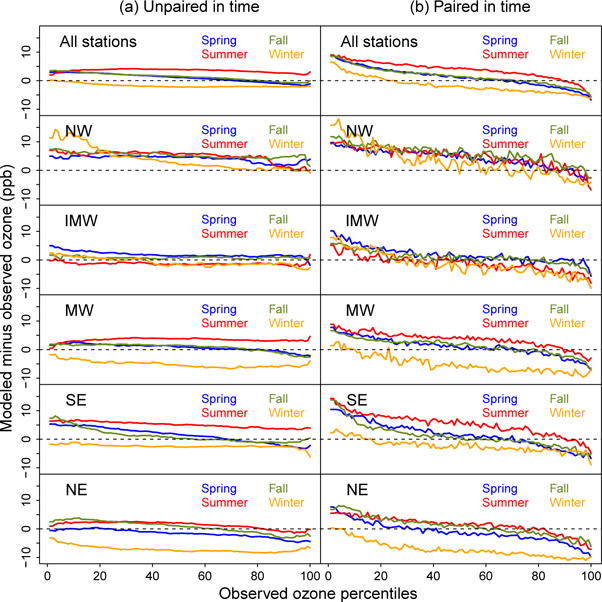
Figure 3.

Differences between observed and BASE-modeled MDA8 ozone at AQS stations for each season and analysis region. For each season and region, the observed MDA8 ozone concentrations were rank ordered at each station. Next, differences between CMAQ simulations and observations were computed for each observed percentile either by selecting the model value corresponding to the date of the observed percentile (paired-in-time comparison, b) or rank ordering the model values and then selecting the modeled percentile corresponding to the observed percentile (unpaired-in-time comparison, a). Finally, the median value of these paired-in-time and unpaired-in-time differences across all AQS stations in a given season and region was then computed for each observed percentile and is depicted in this figure.
