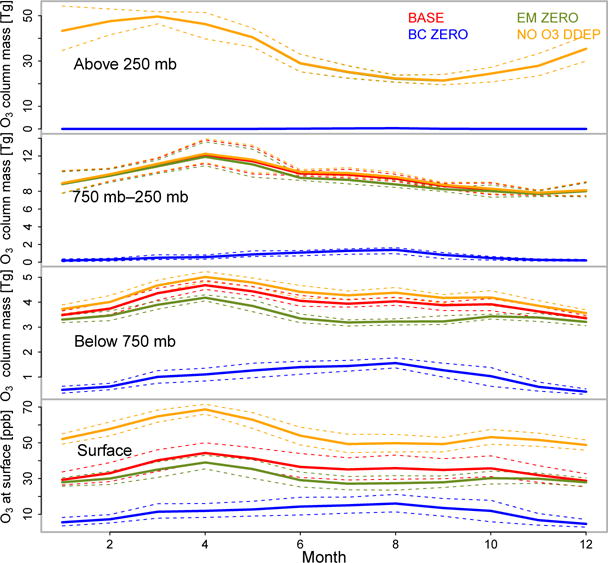
Figure 6.

The upper three panels present time series of the monthly average domain-total ozone column mass for the BASE, BC ZERO, EM ZERO, and NO O3 DDEP sensitivity simulations for the same three layer ranges analyzed in Fig. 5 while the lowest panel presents time series of monthly average domain-average ozone mixing ratios for the first model layer. The dashed lines represent the 5th and 95th percentiles of the hourly domain-total ozone column mass and domain-average ozone mixing ratios for a given month.
