Figure 7.

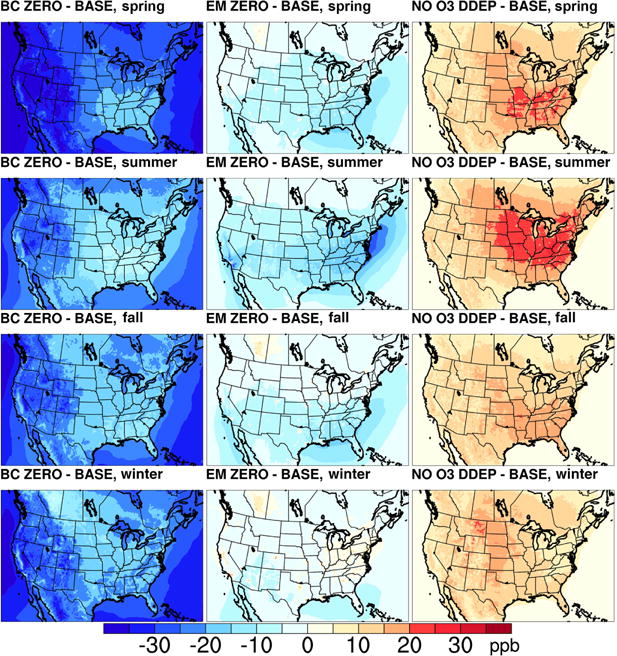
Maps of differences in seasonal mean ozone mixing ratios between the three sensitivity simulations (BC ZERO, EM ZERO, and NO O3 DDEP) and the BASE simulation.

Maps of differences in seasonal mean ozone mixing ratios between the three sensitivity simulations (BC ZERO, EM ZERO, and NO O3 DDEP) and the BASE simulation.