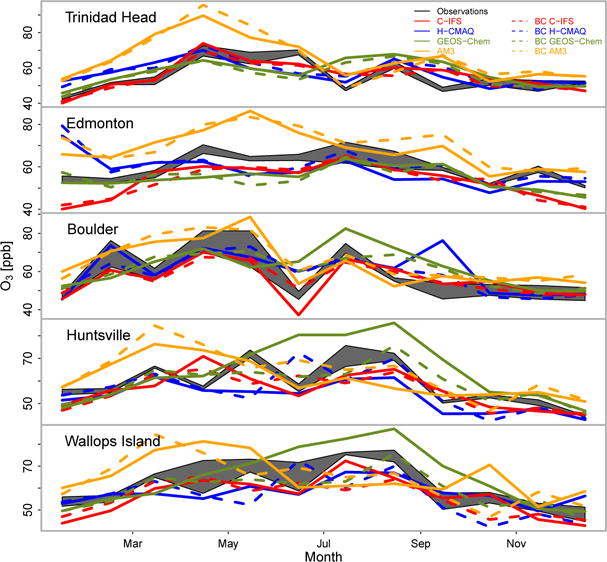
Figure 9.

Monthly average time series of 500 mb observed ozone, ozone simulated by large-scale models (solid lines), and ozone simulated by regional CMAQ driven with boundary conditions from different large-scale models (dashed lines) at Trinidad Head, Edmonton, Boulder, Huntsville, and Wallops Island. Additional details on the processing of observations and model simulations are provided in the text.
