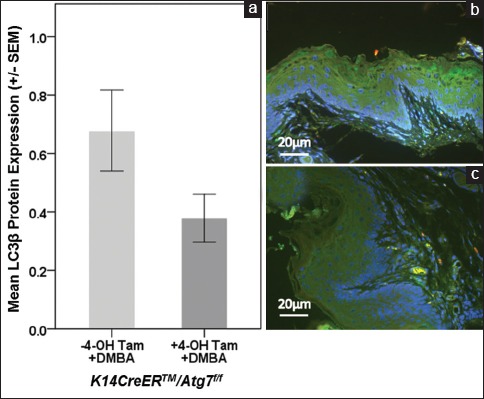
Figure 2.

LC3β protein expression in K14CreERTM+/-\/Atg7f/f mice. Panel A shows that in K14CreERTM+/-/Atg7f/f mice there was a trend toward lower LC3β (green) in 4-OH TAM and DMBA compared to DMBA alone. Panels B (DMBA alone) and C (4-OH TAM followed by DMBA) are representative images
