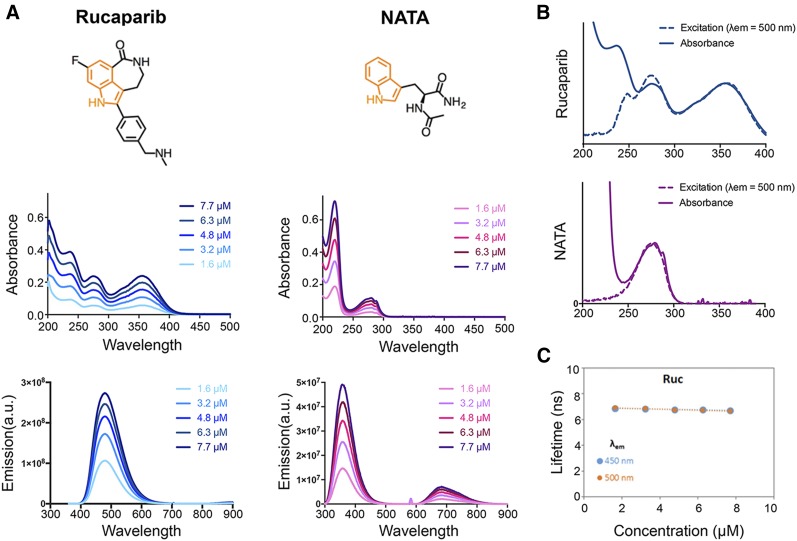
FIGURE 1.
Spectroscopic characterization of rucaparib. (A) Chemical structures with highlighted indole chromophore (orange) and absorbance and emission spectra of rucaparib and NATA at 5 concentrations in water. (B) Fluorescence excitation spectra compared with absorbance (C) and fluorescence lifetime measurement of rucaparib at the emission wavelengths 450 and 500 nm in different concentrations in water.

