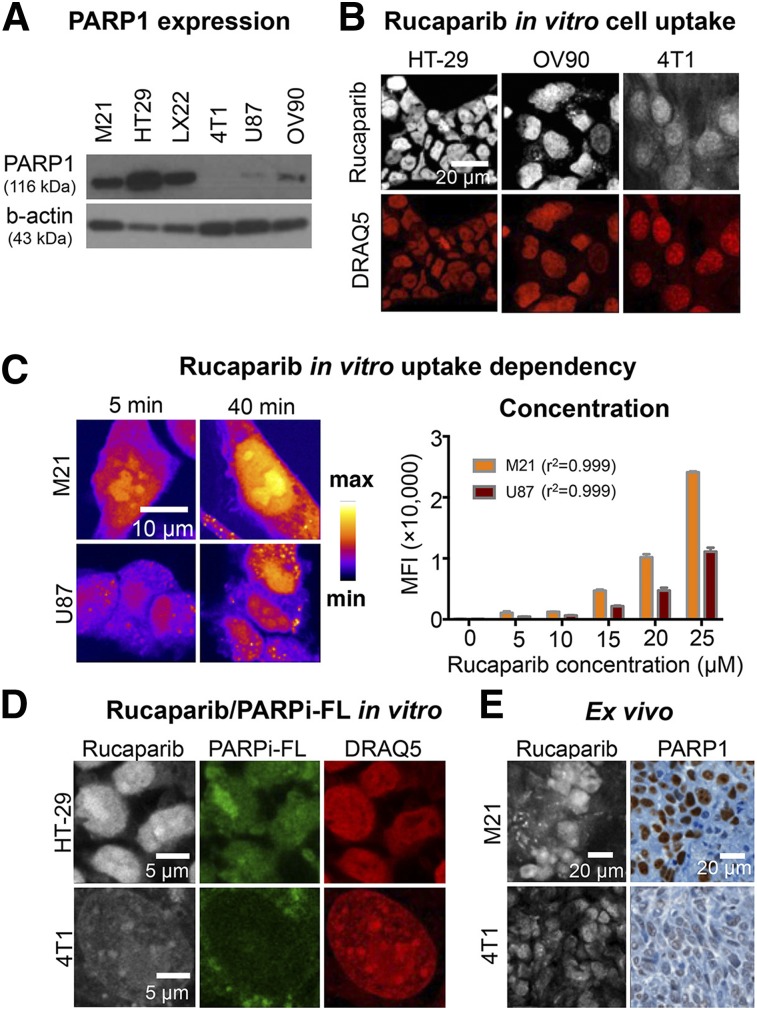
FIGURE 3.
Measurement of PARP1 expression using rucaparib. (A) Western blot of PARP1 protein content of investigated cell lines using anti–PARP1 antibody and β-actin as loading control. (B) Comparison of rucaparib binding in tumor cell lines HT29, OV90, and 4T1 after a 30-min incubation with 5 μM rucaparib. Nuclei were counterstained with DRAQ5, and cells were fixed before imaging. (C) Modulation of incubation time and incubation concentration in M21 (high-PARP1) and U87 (low-PARP1) cells. (D) Comparison of rucaparib and PARPi-FL uptake in HT29 and 4T1 cells after simultaneous incubation at 5 μM. Nuclei were counterstained with DRAQ5, and cells were fixed before imaging. Images of each channel are comparable due to identical window/level settings. (E) Rucaparib detection in cryosections of M21 or 4T1 tumor–bearing mice compared with PARP1 immunohistochemistry. Mice received intravenous injection of 200 nmol rucaparib and were sacrificed 60 min after injection.

