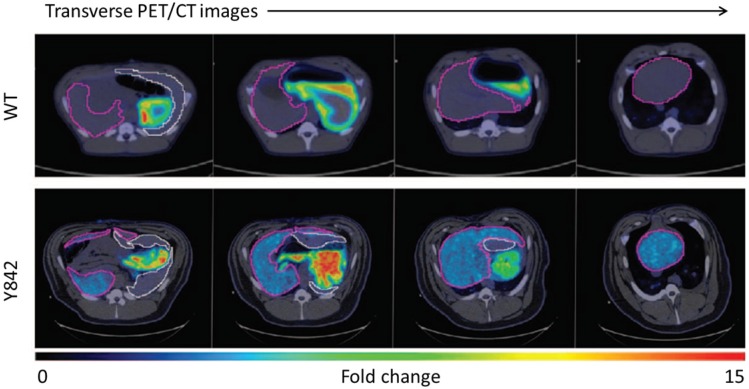
Figure 11.
Representative transverse PET/CT images of a control WT pig and pig Y842 after injection of [18F]TFB. Different positions of the liver are shown from head (left side) to feet (right side) of the animals. The relative intensity of [18F]TFB uptake is represented by low (blue) to high (red). The liver is outlined in purple, and the spleen is outlined in white. Reproduced with permission from 62, copyright 2016 Science Translational Medicine, an exclusive license.

