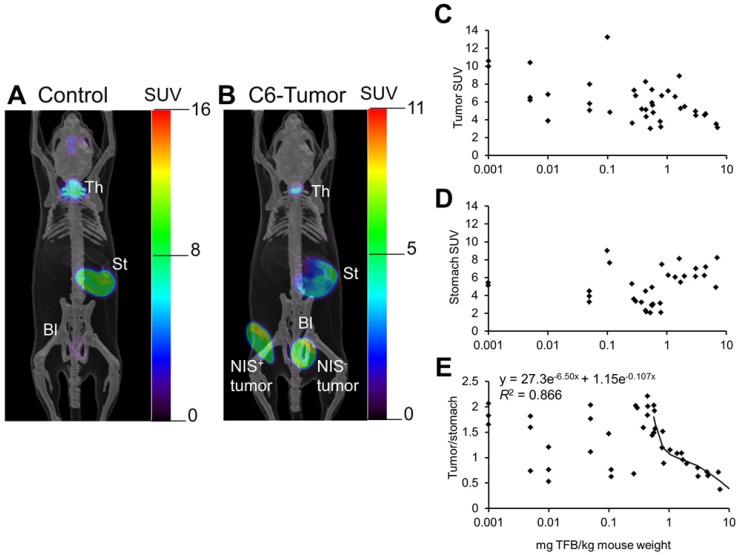
Figure 6.
PET images of [18F]TFB distribution at 60-70 min in (A) control mouse and (B) mouse bearing hNIS-positive and hNIS-negative C6-glioma xenografts. Overlaid reference bone atlas is computer generated. Bl: bladder; St: stomach; Th: thyroid. Dependence of (C) tumor, (D) stomach, and (E) tumor-to-stomach ratio of [18F]TFB uptake at 60-70 min on administered mass of TFB to hNIS-expressing C6-glioma xenografted mice. Tumor-to-stomach ratio data for administered mass greater than 0.5 mg/kg was fit to a biexponential clearance model using nonlinear least-squares regression. Reproduced with permission from 53, copyright 2016 Society of Nuclear Medicine and Molecular Imaging, Inc.

