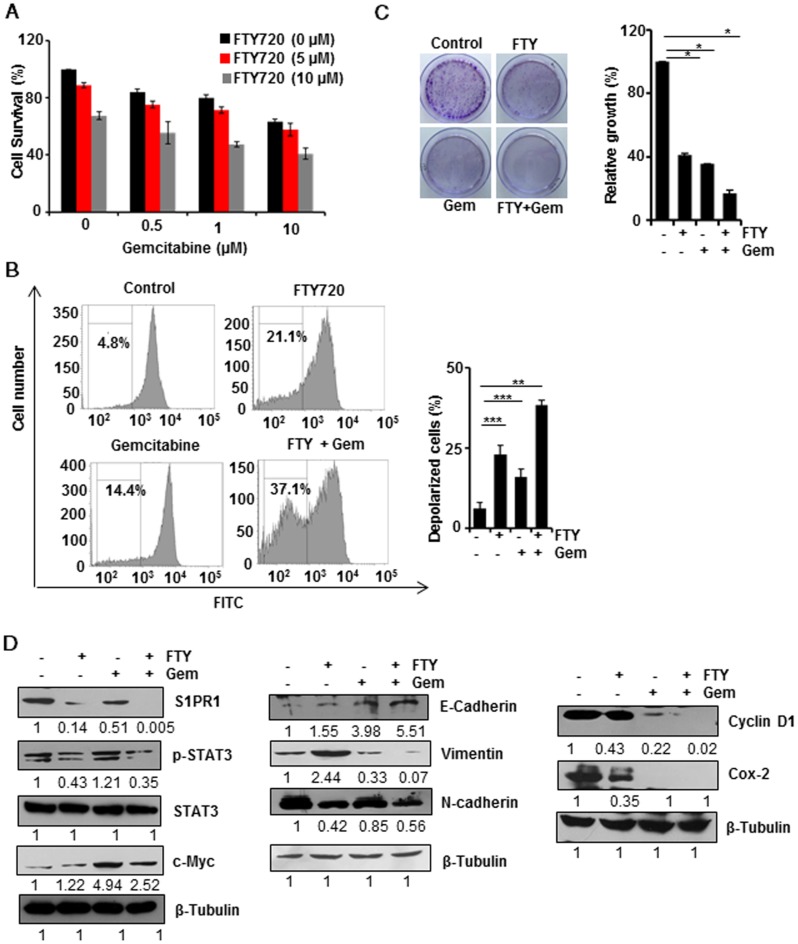
Figure 2.
FTY720 enhanced the effects of gemcitabine in pancreatic cancer cell lines. (A) MIA PaCa-2 cells were treated with indicating concentrations of FTY720and gemcitabine (for 24h) and cell survival was analyzed using MTT assay. (B) MIA PaCa-2 cells were treated with FTY720 in combination with gemcitabine and the loss in mitochondrial membrane potential was quantified using DiCO6(3) staining after 24h. (C) The clonogenic potential of the cells was quantified after 24 h pre-treatment of cells with the drug alone and the combinations and incubating for 24h. Cells were collected and plated again as 1000 cells per well and allowed them to grow in drug free environment. Representative images were shown in left panel. Then the colonies were fixed with 10% neutral buffered formalin and stained with crystal violet. The quantification was performed using TECAN spectrophotometer at 590nm after melting the stained colonies (right panel). (D) MIA PaCa-2 cells were treated with FTY720 and in combination with gemcitabine for 24h and the expression of S1PR1, p-STAT3, STAT3, and c-Myc; EMT markers, E-cadherin, N-cadherin and Vimentin and proliferative markers CyclinD1 and Cox-2 expression were analyzed using western blotting.β-Tubulin served as internal control

