Figure 2.
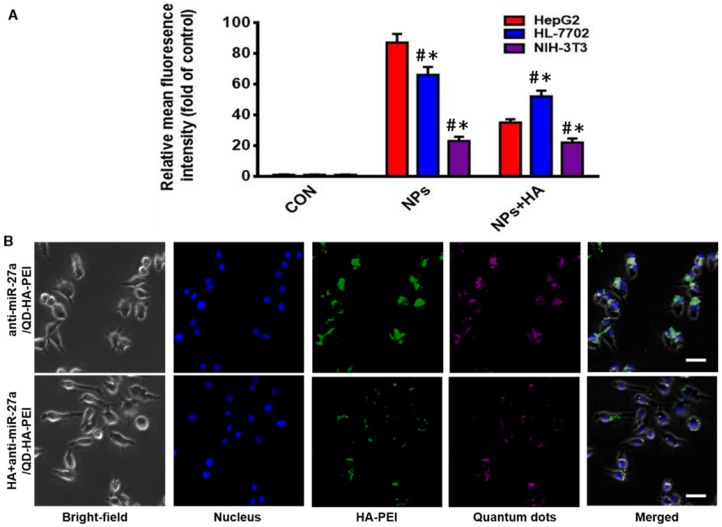
CD44-targeted cellular uptake of anti-miR-27a/QD-HA-PEI. (A) Quantitative analysis of the internalization of anti-miR-27a/QD-HA-PEI in HepG2, HL-7702 and NIH-3T3 cells after 3 h of exposure through FACS. These data represent three separate experiments and are presented as the mean values ± SD. *P < 0.05 versus the NPs group, #P < 0.05 versus the HepG2 group. (B) CLSM images of HepG2 cells after 3 h of incubation; the scale bars represent 10 μm.

