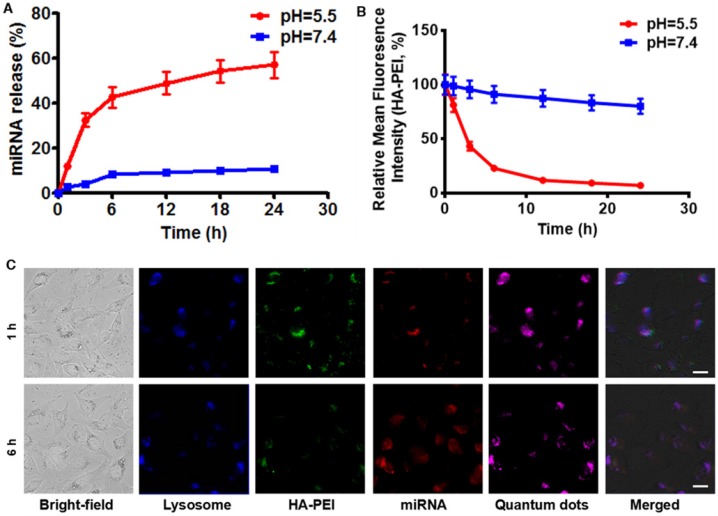
Figure 3.
RNA release behavior and “ON-OFF” fluorescence switching of anti-miR-27a/QD-HA-PEI. (A) RNA release profile and (B) normalized fluorescence intensity of anti-miR-27a/QD-HA-PEI under different pH conditions. (C) CLSM images of HepG2 cells after 1 or 6 h of incubation; the scale bars represent 10 μm.

