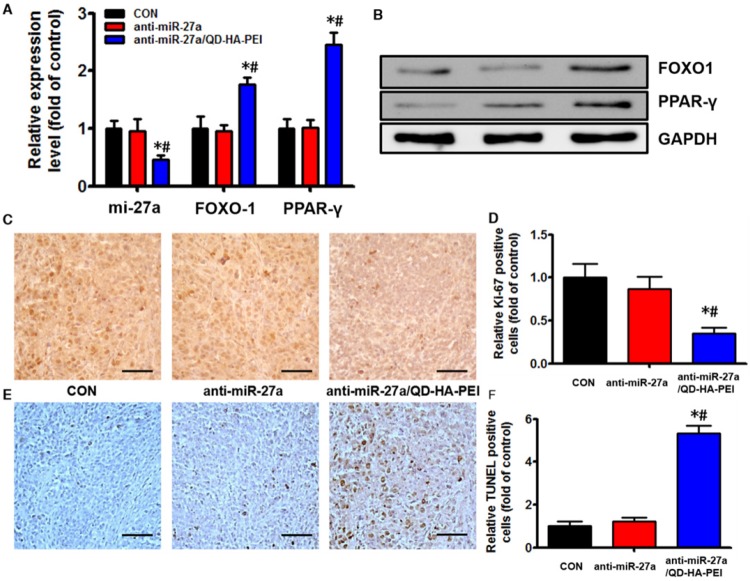
Figure 9.
In vivo anti-tumor mechanisms of anti-miR-27a/QD-HA-PEI. (A) miR-27a and miRNA of FOXO1 and PPAR-γ expression, (B) protein expressions of FOXO1 and PPAR-γ, (C) Ki-6-stained images and (D) quantitation, (E) TUNNEL-strained images and (F) quantitation of tumor sites in each group. The values represent mean values ± SD, n=6. *P < 0.05 versus anti-miR-27a group. Scale bars represent 100 µm.

