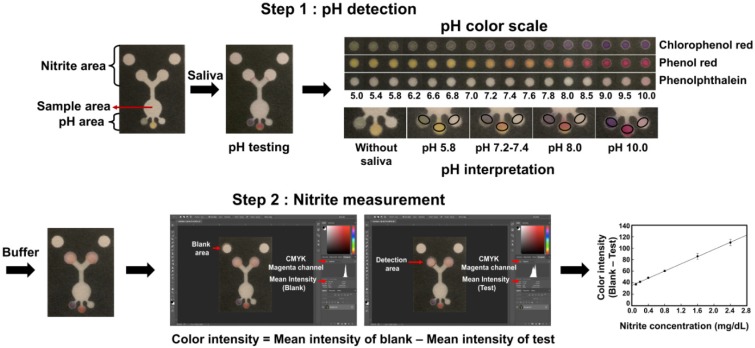
Figure 1.
Image of the PAD and scheme for pH and nitrite determination. Step 1 describes the process for naked eye determination of the pH. The black circle indicates the position for pH measurement. The color inside the black circle is then compared to the pH color scale for pH determination. Step 2 describes the process for quantifying color intensity measuring using the program Photoshop® for nitrite concentration determination. The concentration of nitrite in saliva samples was calculated from the calibration curve.

