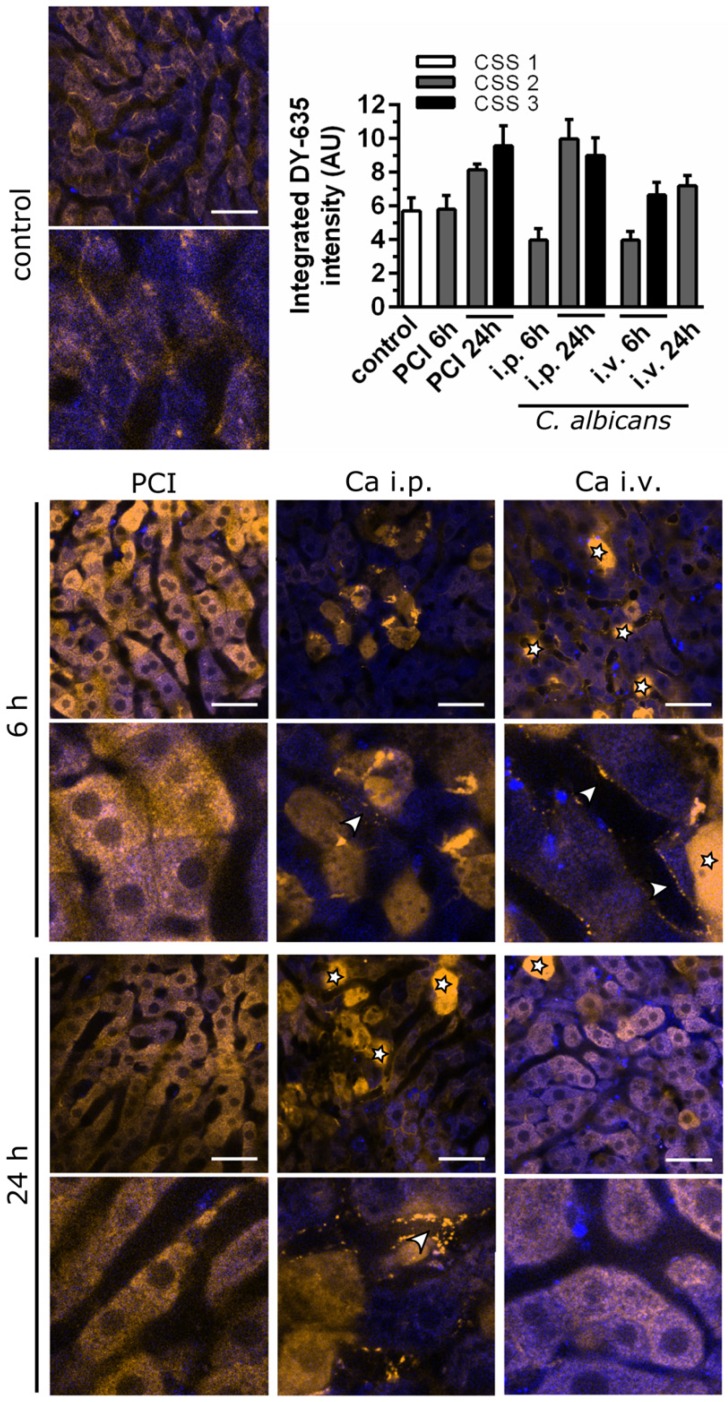
Figure 6.
Intravital microscopy shows early pre-hepatic dysfunction for C. albicans infection. Murine liver tissue is depicted by NAD(P)H autofluorescence (blue); DY‑635 accumulation and excretion are depicted 60 min after injection (yellow). Scale bars = 100 µm. Stars indicate dead cells (verified by post-experimental propidium iodide staining); arrowheads indicate pre-hepatic dye accumulation. Intensities of DY‑635 were analyzed by a customized image analysis algorithm. Tissue DY‑635 signal was integrated over 60 min to assess liver function by means of DY‑635 uptake and elimination. Subgroups are separated by their respective clinical severity score (CSS).

