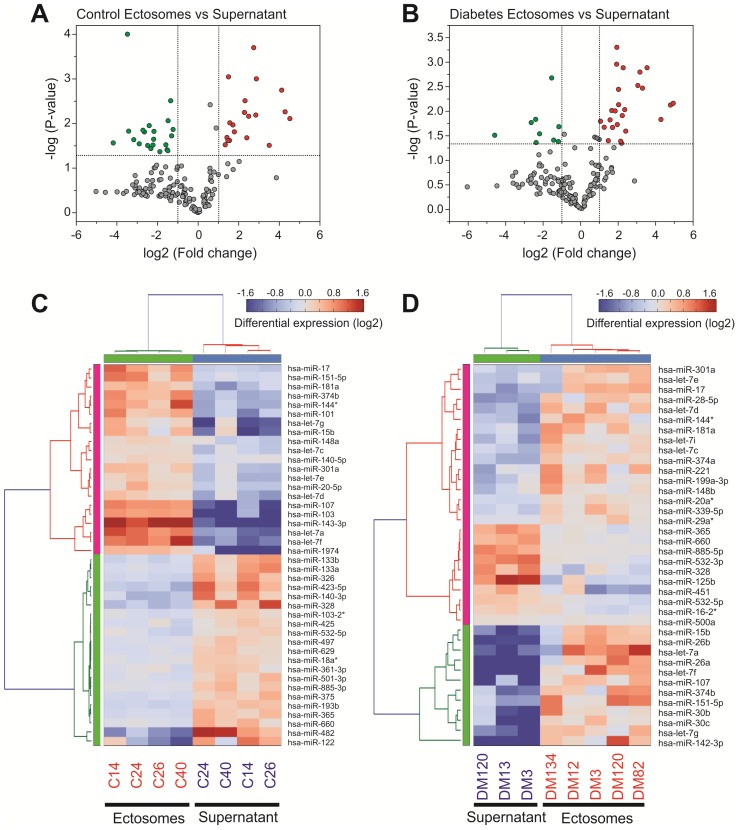
Figure 6.
qPCR screening of enriched and depleted miRNAs present in Ects compared with those present in corresponding supernatants. Volcano plots of specific miRNAs present in the Ect-enriched plasma fraction compared with those present in corresponding supernatants obtained from (A) healthy controls and (B) patients with T2DM. Green and red dots represent significantly down- and upregulated miRNAs, respectively, taking into account the following thresholds: p-value < 0.05 and fold-change >2. Heatmap for the differentially enriched miRNAs in Ects obtained from (C) healthy control and (D) patients with T2DM.

