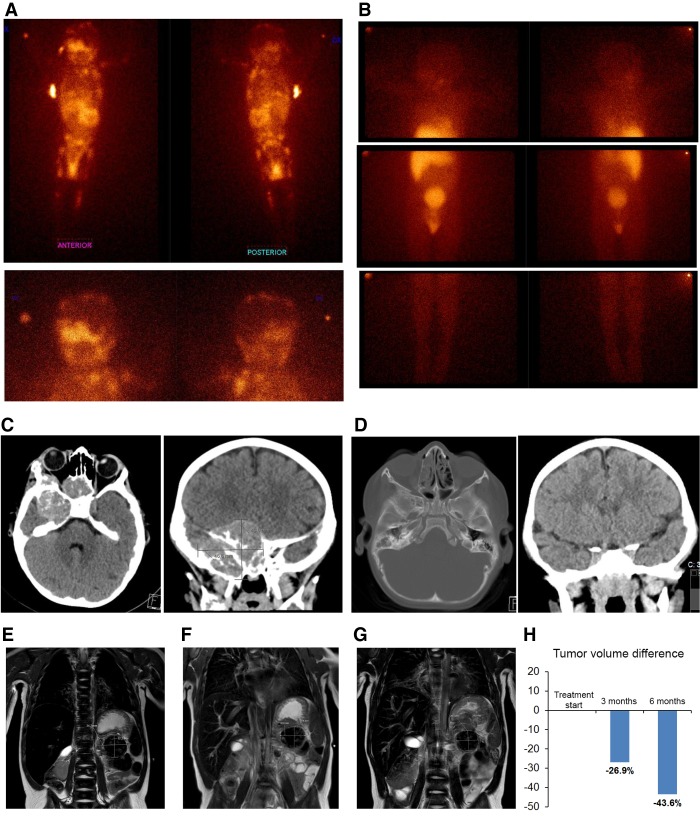
Figure 1.
Patient tumor imaging. Disease at initial diagnosis and after targeted therapy in full clinical remission (A–D). (A) Whole-body MIBG-I123 scintigraphy showing extensive metastatic disease at diagnosis of high-risk neuroblastoma (upper panels). (Left panel) anterior view; (right panel) posterior view. Lower panels display head and neck region. (B) MIBG-scintigraphy after 21 mo of ceritinib therapy showing complete remission at all metastatic sites. (C) Brain CT scans at diagnosis showing a CNS metastasis (43 mm × 46.7 mm) posterior to the right orbit. (D) CT scans after 21 mo of ceritinib therapy showing complete metastatic response. (E–H) Primary tumor immediately before and after targeted therapy. (E) Magnetic resonance imaging (MRI) of primary abdominal tumor (indicated by arrows and measurements inserted) immediately before start of ceritinib targeted therapy (∼18.8 mL tumor volume), (F) MRI after 3 mo therapy (∼13.8 mL tumor volume), and (G) MRI after 6 mo therapy immediately prior to radical surgery (∼10.6 mL tumor volume). (H) Decrease of evaluable tumor volume after 3 and 6 mo of targeted therapy.

