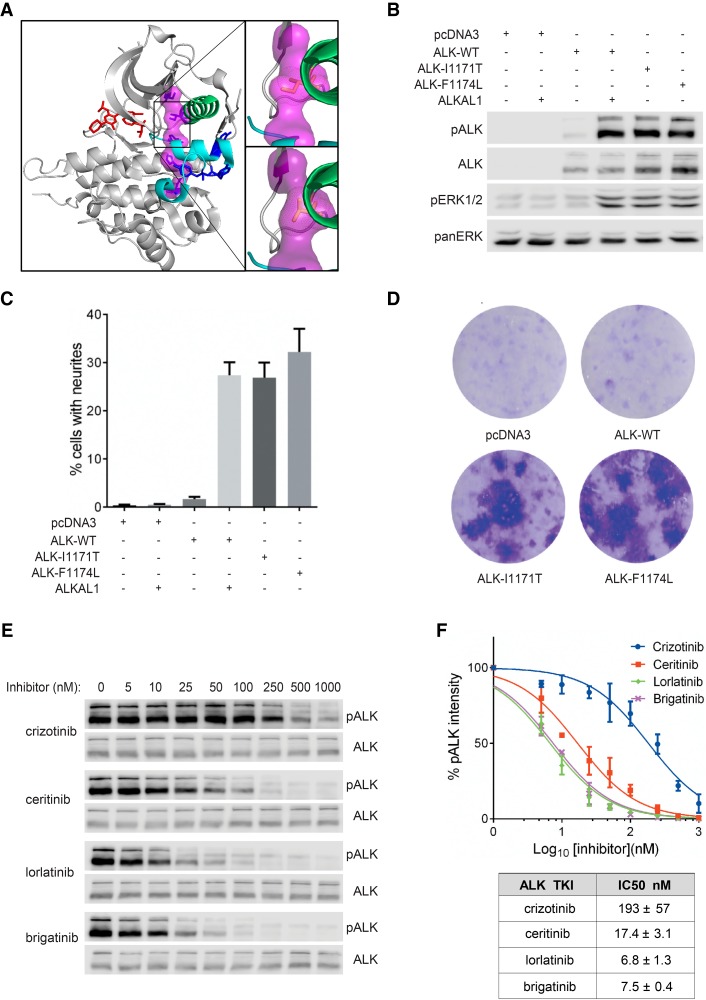
Figure 3.
Characterization of ALK-I1171T with cell culture systems. (A) Model of the ALK kinase domain (PDB #3LCS) using PyMol, which can be divided into the upper amino-terminal lobe and the lower carboxy-terminal lobe by the hinge region and ceritinib binding/ATP (red) binding pocket. Regulatory spine (R-spine) residues are shown in magenta. The spine is anchored in the αF-helix (D1311) and includes the DFG (F1271) and the HRD motif (H1247) of the C-lobe. R-spine residues in the amino-terminal lobe include the β4 strand (C1182) and the residue mutated in this patient in the αC-helix (I1171). Mutation of residue I1171 to threonine in PyMol, results in a small shift, which potentially drives a dynamic allostery that results in a gain-of-function ALK activity (upper insert: wild-type ALK kinase domain; lower insert: ALK-I1171T kinase domain). (B) ALK kinase activity and activation of downstream signaling pathways were visualized by western blot with antibodies against pALK (Y1604) and pERK1/2. Total ALK and pan-ERK were used as loading controls. Blots are representative of three independent experiments. (C) Neurite outgrowth of PC12 cells as a readout for ALK kinase activity was performed with wild-type ALK and ALK variants in the absence or presence of ALKAL1 ligand. Bars represent mean percentage ± STD of neurite-carrying cells among GFP-positive cells from three independent experiments. (D) Representative focus formation assays for NIH 3T3 cells transfected with wild-type ALK, ALK variants (ALK-I1171T and ALK-F1174L), or empty vector. (E) Inhibition profiling of ALK TKIs on ALK-I1171T. PC12 cells expressing ALK-I1171T were treated with serial dilution of ALK inhibitors as indicated. Phosphorylation of ALK was detected with pALK (Y1604) antibody and total ALK was used as loading control. (F) IC50 values of different ALK inhibitors were calculated with GraphPad Prism 6.0 by fitting data to a log (inhibitor concentration) versus normalized response (variable slope) equation and shown in the accompanying table. Values represent average ± STD from three independent experiments.

