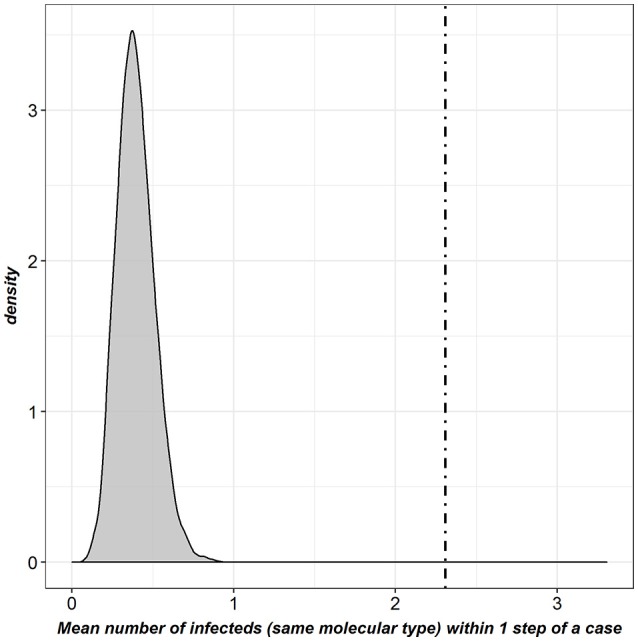
Figure 5.

Graphical representation of the k-test results for the full contact network [dot-dashed line: k-statistic computed in the observed network; gray density plot: distribution obtained by randomly reallocating the location of cases; this last distribution was clearly lower than the k-statistic observed (p < 7.14*10−3, threshold after Bonferroni correction)].
