
FIGURE 8.
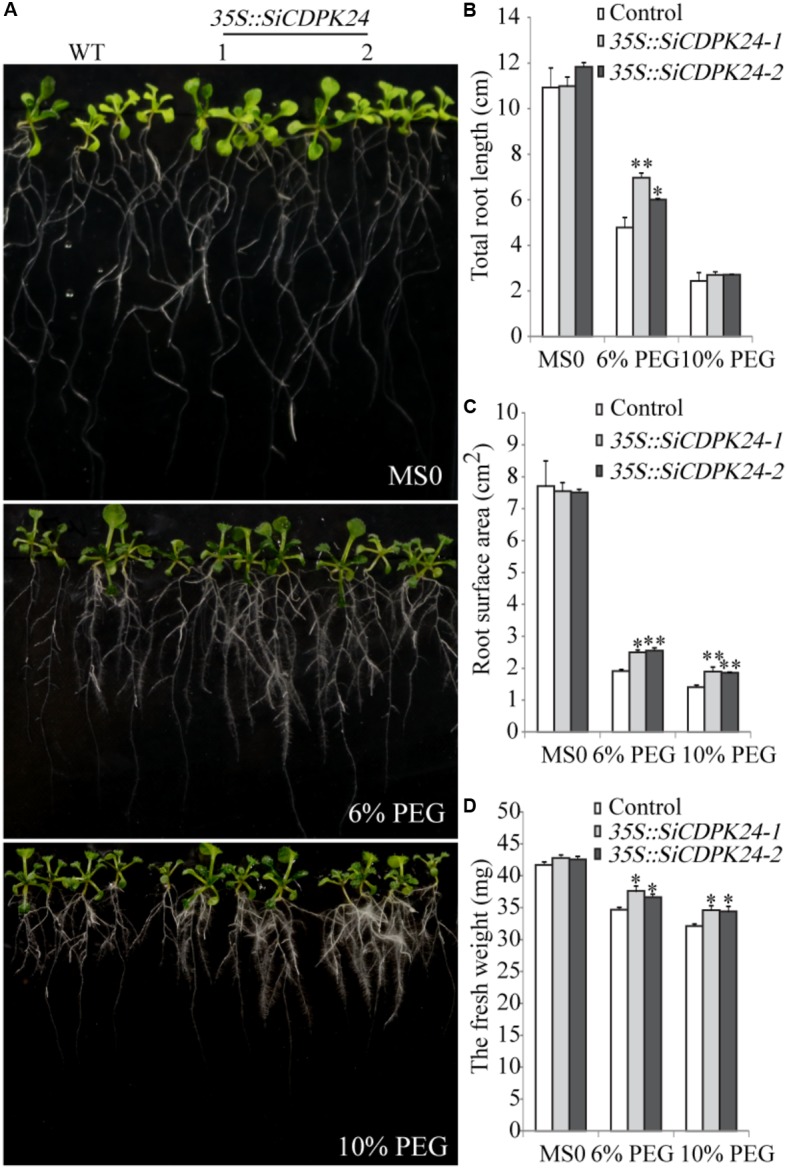
Phenotype identification of transgenic and WT seedlings under PEG6000 stress. (A) Growth states of transgenic and WT seedlings under different concentrations of PEG6000 treatment. (B) Total root lengths of transgenic and WT Arabidopsis seedlings under different concentrations of PEG6000 treatment. (C) Root surface areas of transgenic and WT Arabidopsis seedlings under different concentrations of PEG6000 treatment. (D) Fresh weights of transgenic and WT seedlings under different concentrations of PEG6000 treatment. Vertical bars indicate ±SE of three replicates. ∗ and ∗∗ indicate significant differences in comparison with the WT lines at 0.01 < P < 0.05 and P < 0.01, respectively.