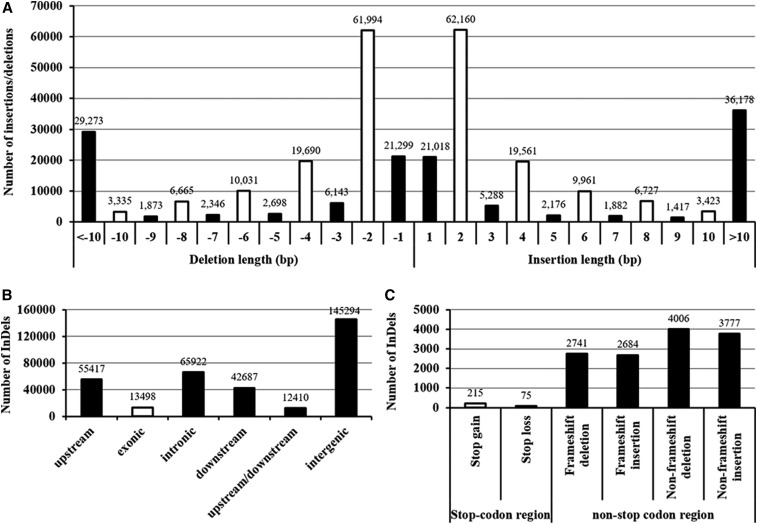
Figure 5.
Annotation of insertions/deletions (InDels) identified between the N-efficient genotype “XY15” and the N-inefficient genotype “814”. (A) The frequency distribution of different InDel sizes. The x-axis represents the InDel sizes (bp): the positive and negative values indicate nucleotide insertion and deletion in “XY15” relative to “814”, respectively. (B) Genic distribution of the InDels. (C) The frequency distribution of large-effect InDels in the coding regions.

