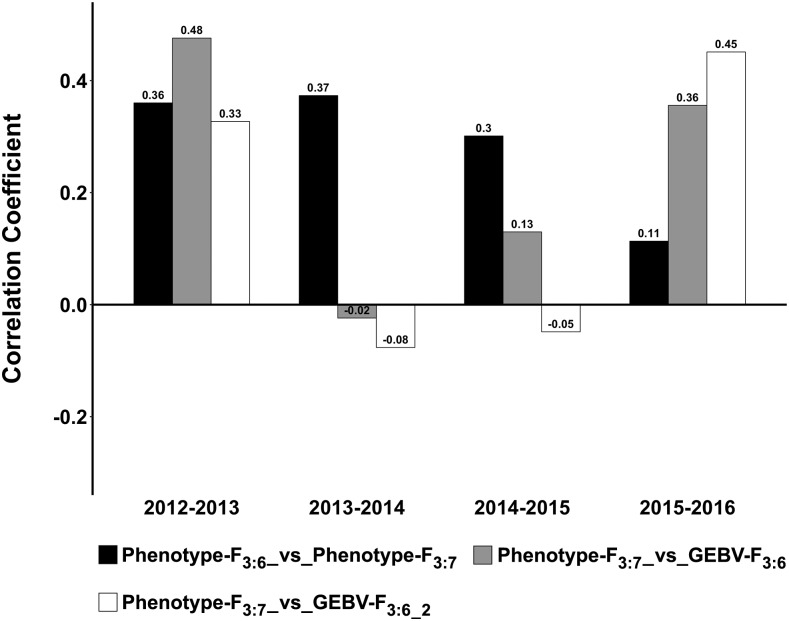
Figure 3.
Comparison of phenotypic and genomic selection. The comparison is made using 57 lines advanced from the preliminary yield trial (F3:6) grown in 2012-2015 to the advanced yield trial (F3:7) grown in 2013-2016. The suffix “2” separated by an underscore represents scenarios where the genomic estimated breeding values of the preliminary yield trials (F3:6) are estimated by excluding the following (F3:7) year from the training set. Correlation coefficients noted on the bar plots.

