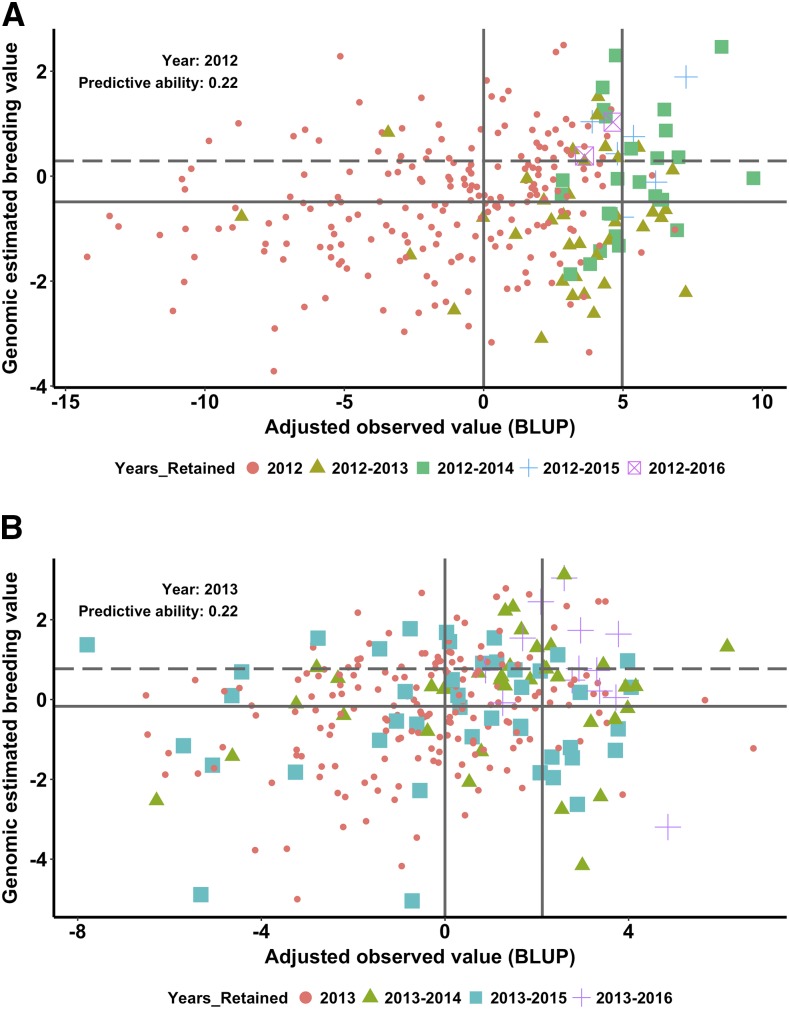
Figure 4.
Comparison of adjusted observed grain yield values (best linear unbiased predictors, BLUPs) and genomic estimated breeding values (GEBVs) for lines tested in 2012 (a) and 2013 (b) preliminary yield trials (PYTs). The lines advanced in each year from the 2012 and 2013 PYT nursery until 2016 are highlighted with different colors and shapes. The two vertical lines represent the mean of the BLUPs of the PYT nursery and the mean of the BLUPs of the 57 PYT lines selected for advancement to the advanced yield trial nursery. The two horizontal lines indicate the mean (solid) and the 75th percentile of the genomic estimated breeding values (dashed).

