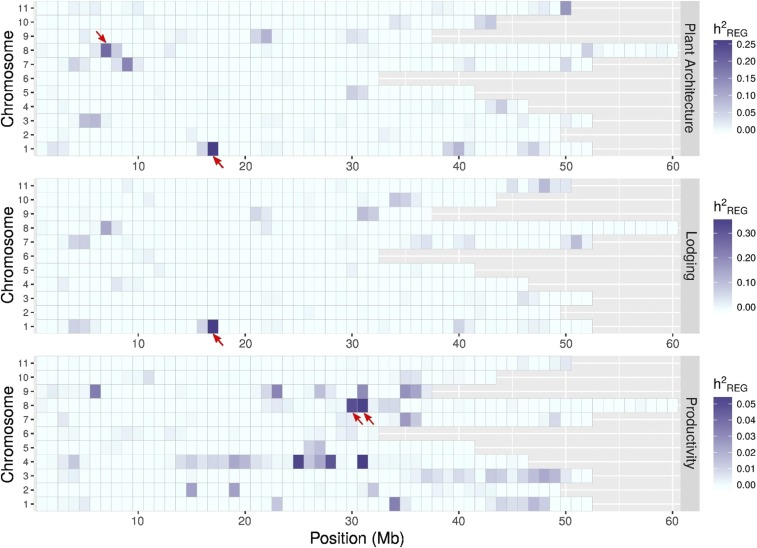
Figure 3.
Genome-wide distribution of the significant QTL detected in the joint analysis by RHM along the 11 common bean chromosomes (y-axis) subdivided in 1 Mb windows for the three traits (right). Bar legends on the right correspond to regional heritability estimates. Red arrows indicate significant regions according to LRT test.

