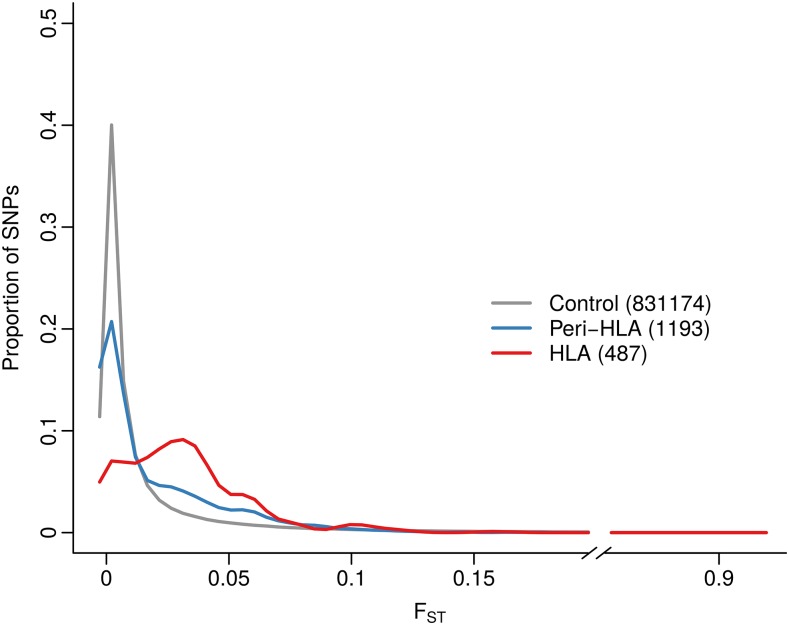
Figure 1.
Distribution of F values for exonic SNPs from the following groups: outside HLA and peri-HLA regions (control group), within HLA genes and within peri-HLA genes. The number of SNPs in each group is shown in parentheses. Density was estimated for each category of SNPs at 190 points equally spaced along the range of observed F values, using a Gaussian kernel. Density at each point was normalized by dividing by the sum of densities at each category, such that the height represents the proportion of SNPs with that F value.

