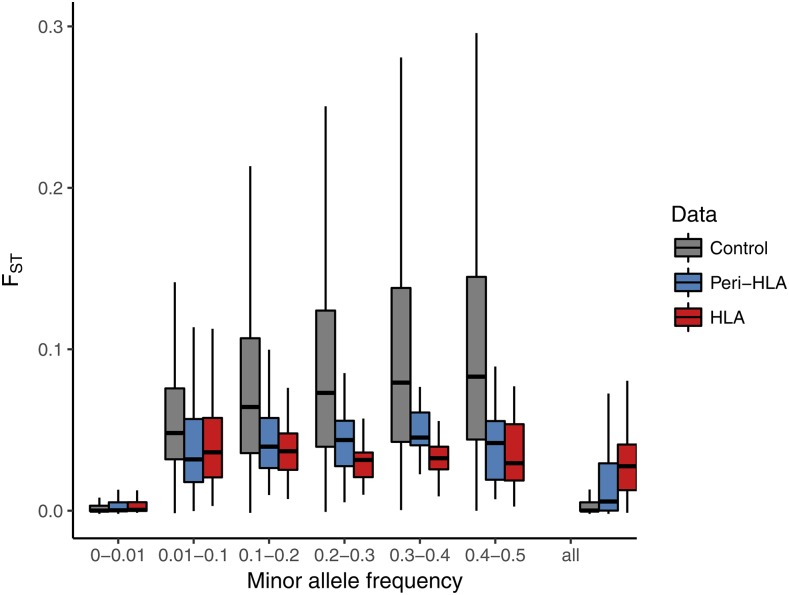
Figure 4.
F distributions per minor allele frequency (MAF) bin. HLA and peri-HLA SNPs show lower F than control SNPs in all bins with MAF Outliers (points above the 3rd quartile by 1.5 times the interquartile range, or below the 1st quartile by the same amount) were removed from figure, but not from statistical test, for better visualization. Figure S7 shows F distributions including outliers.

