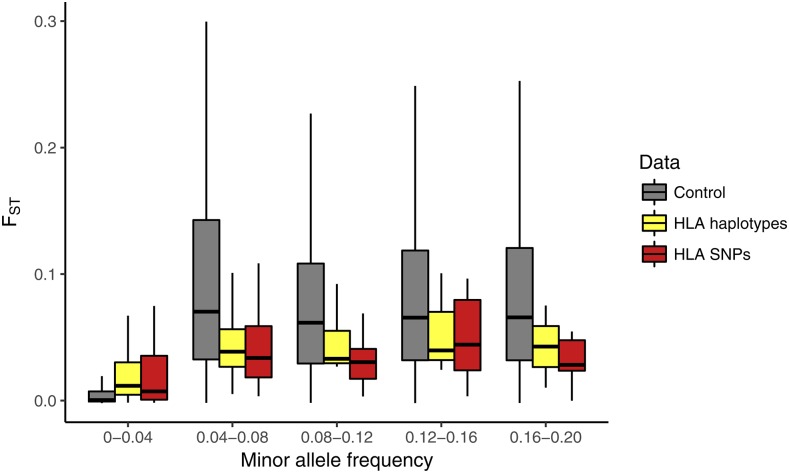
Figure 5.
Population differentiation (F) as a function of minor allele frequency for the exonic control SNPs (gray), for exonic HLA SNPs (red) and for the haplotype-level HLA alleles (yellow) after recoding as biallelic (see Materials and Methods). No haplotypes had frequency higher than 0.2, therefore MAF bins were redefined.

