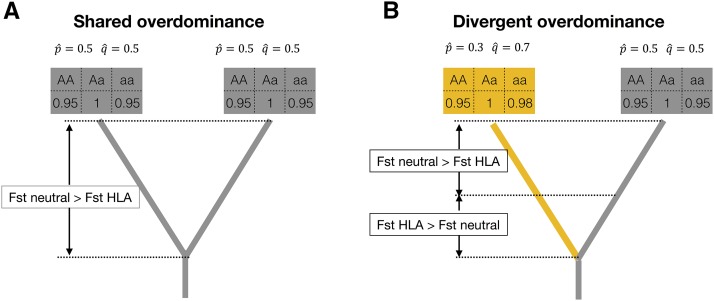
Figure 8.
Schematic representation of HLA differentiation under two regimes of overdominance. Each tree represents a population pair experiencing selection according to fitness values presented in the boxes above the tips. The equilibrium frequencies expected under these fitness values are also shown ( and ). In ”shared overdominance” both daughter populations share the same fitness values. In ”divergent overdominance” the fitness values for one of the homozygotes changes in one of the daughter populations, even though the regime is still one of overdominance. In the divergent overdominance scenario, the equilibrium frequencies at the selected site differs among populations, and drives increased differentiation when divergence is recent (F HLA > F neutral). For the shared overdominance scenario F neutral > F HLA throughout the entire history of population divergence.

