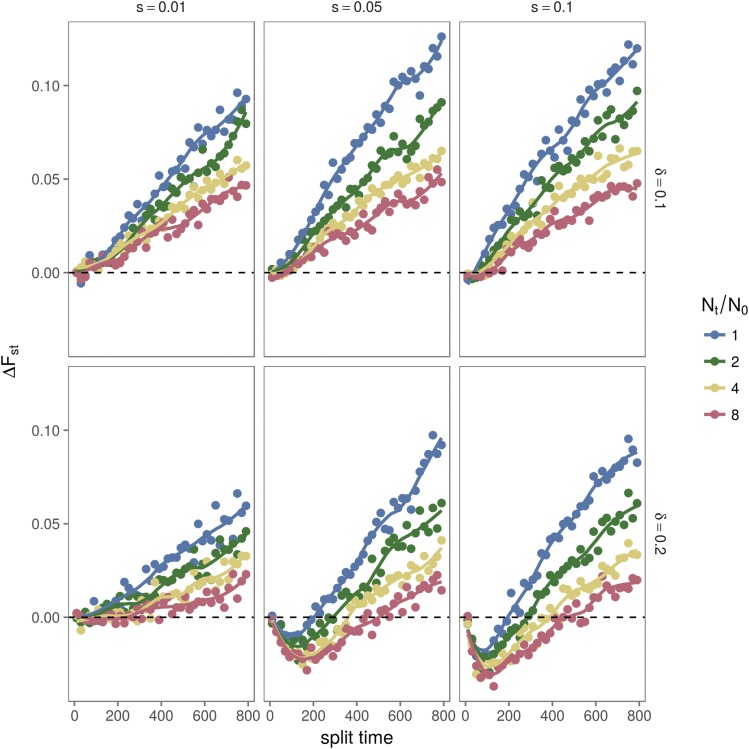
Figure 9.
Difference between under neutrality and under overdominance (), for different selective scenarios. For all scenarios shown here, we used an initial equilibrium frequency of 0.5 (), and varied population split times, size fold change (), selective coefficient (s) and difference of equilibrium frequencies after split (δ). Notice that for the case of a small change in equilibrium frequency after the split (), the under neutrality is always greater then the under divergent overdominance ( for every time after the divergence). For higher values of frequency difference () and selection coefficient ( the under neutrality is smaller than the under divergent overdominance () for times closer to the split of the populations while for times far from the split the under neutrality becomes greater then the under divergent overdominance ().

